Reports tab Implementation
In the Reports tab we have more analysis on Income and Expense details provided. They are:
- Monthly Income Summary
- Categorized Expense Report
- Income Vs Expense Trends
- Expense - Payment Patterns
- Expense Analysis by Day Of Week and
- Categorized Income Report.
All the above reports are designed in Zoho Reports and embedded into this application using the Embed option (invoke "Publish-> Embed in Website/Blogs" menu item).
Here the Monthly Income Summary and Categorized Expense Report are created as Pivot reports(?) in Zoho Reports. They provide the break up details of Income and Expense at a glance.

Monthly Income Summary provides summation of Income Data grouped by income category and month, with grand totals at each group level. Categorized Expense Report provides summation of Expense grouped by each expense category and the payment mode for each month.
Income Vs Expense Trends is a Chart view (?) developed on a Query Table (?) generated by a SQL Query combining two tables IncomeDetails and ExpenseDetails. This chart gives a collective picture of one's earning, spending and the saving habits. It is generated with "Date" on X-Axis and "Amount"(Income and Expense) on Y-Axis.
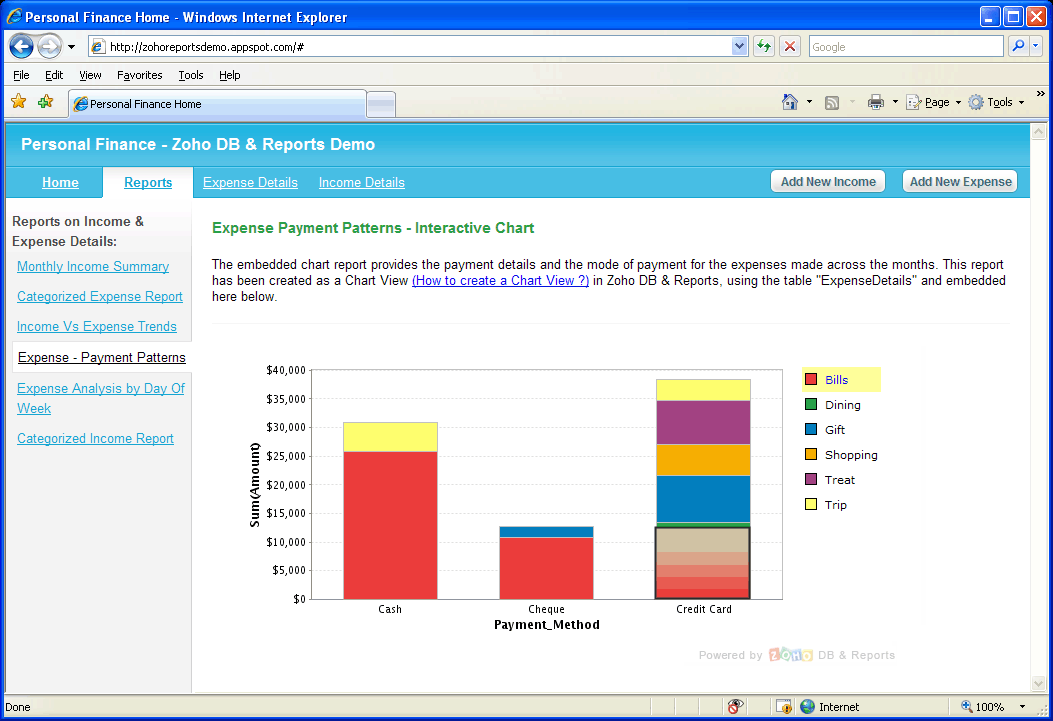
The embedded interactive reports Expense - Payment Patterns and Expense Analysis by Day Of Week are also Chart views developed on the ExpenseDetails table. The Stacked Bar chart conveys the payment methods along with the other payment details so far. The second chart describes the money spent on each day of the week so far and this has been created as a bar chart.
Screen shot of the Payment patterns chart
And the last report in this page is Categorized Income Report. It is a Tabular view on the IncomeDetails table. This view groups the data by the Income Category with the category-wise grand totals.
Zoho Reports Personal Finance Database used to generate the above reports can be accessed here.